
TL;DR: To use Inspect Element, right-click any part of a webpage and choose Inspect, or press F12 (Ctrl + Shift + I on Windows, Cmd + Option + I on Mac). Your browser opens Developer Tools, showing the page’s HTML and CSS, where you can view and test changes live.
Have you ever wanted to see what’s happening under the hood of a webpage?
When something goes wrong on a website—like a broken image or a misaligned section—it can be hard to figure out what caused it.
That’s where Developer Tools, specifically Inspect Element, comes in handy. This tool allows you to view and temporarily edit the code behind any webpage, helping you pinpoint errors and troubleshoot issues in real time.
Whether you’re dealing with broken links, layout problems, or JavaScript errors, Inspect Element is your go-to for troubleshooting and resolving issues efficiently.
And if you’re working with a code management tool such as WPCode, it’s even more essential. So, let’s see how to use Developer Tools and make the most of it.
Quick Access:
What Is Developer Tools (Inspect Element)?
Most modern browsers, such as Chrome, Firefox, Safari, and Edge, come with built-in tools for web developers, collectively known as developer tools. One of the most popular features is “Inspect Element,” which lets you view and interact with the code behind any webpage.
When you use “Inspect Element,” a panel opens showing the HTML, CSS, and JavaScript of the selected part of the page. This gives you a real-time look at how the webpage is built and works. You can make changes to the code and see how they affect the page without altering the actual website.
For example, if you use WPCode to add custom code to your WordPress site and it’s not displaying as expected, Inspect Element helps you quickly find out if there’s a problem with the code or a conflict with existing CSS. This instant feedback is crucial for fixing issues before they affect your live site.
Whether you’re a developer, designer, or just curious, “Inspect Element” offers valuable insights into how any website works.
Why Is Developer Tools Necessary?
Developer Tools (DevTools) offer powerful tools that help developers build, optimize, and fix web pages. While you can’t make permanent changes to a webpage with DevTools, they are essential for developing and debugging.
Here are a few things you can do with Developer Tools:
- Real-Time Editing and Debugging: DevTools lets you quickly change HTML, CSS, and JavaScript directly in your browser. This is great for testing and fixing issues without refreshing the page or changing the original files.
- Responsive Design Testing: DevTools allow you to see your website’s appearance on different screen sizes and devices. This ensures your site works well on both mobile and desktop.
- Performance Optimization: DevTools help you check how fast your website loads and see which parts are slowing it down. You can watch network activity, find slow-loading resources, and fix them.
How To Access Developer Tools
If you are using major browsers, i.e., Google Chrome, Firefox, Safari, and Microsoft Edge, you can use the keyboard shortcut to access developer tools.
Keyboard shortcuts for launching developer tools in web browsers on:
- Windows: CTRL + Shift + I.
- MacOS: Command + Options + I.
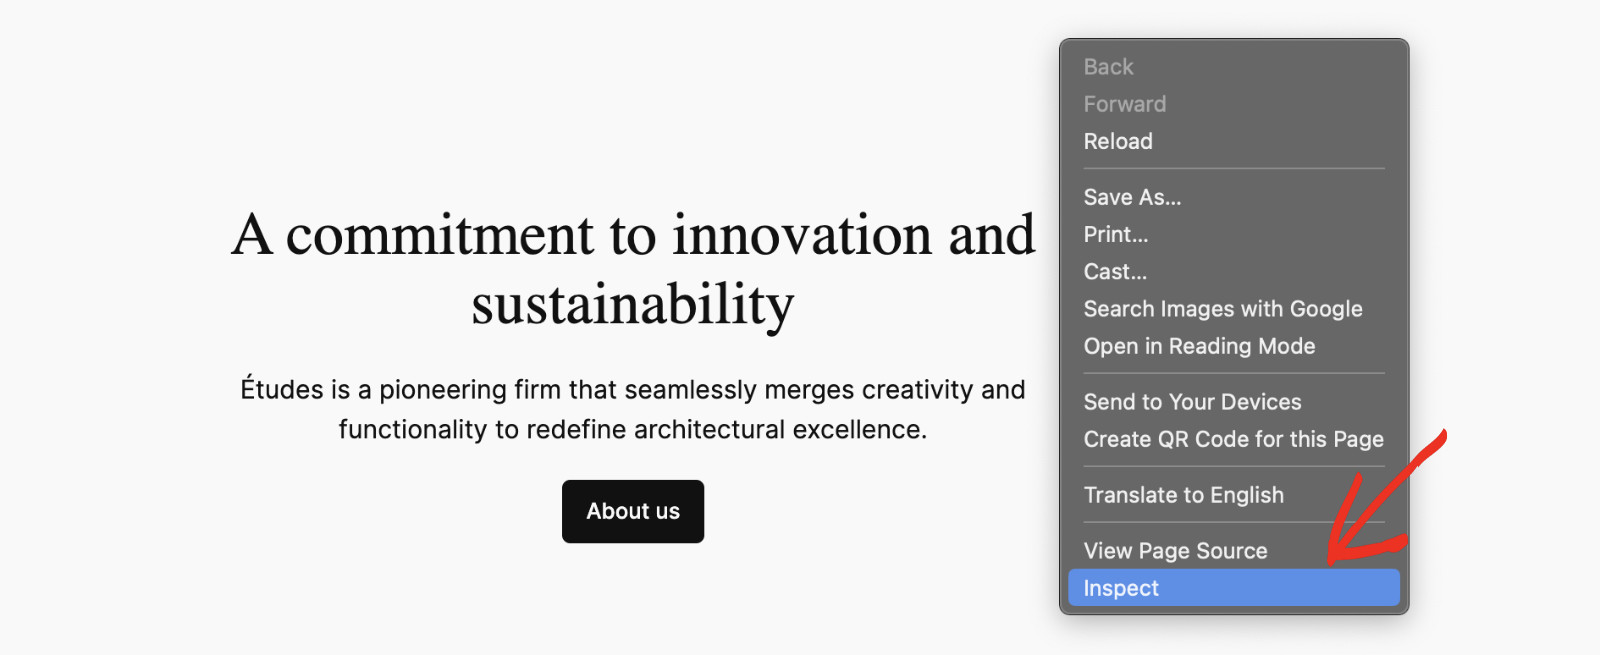
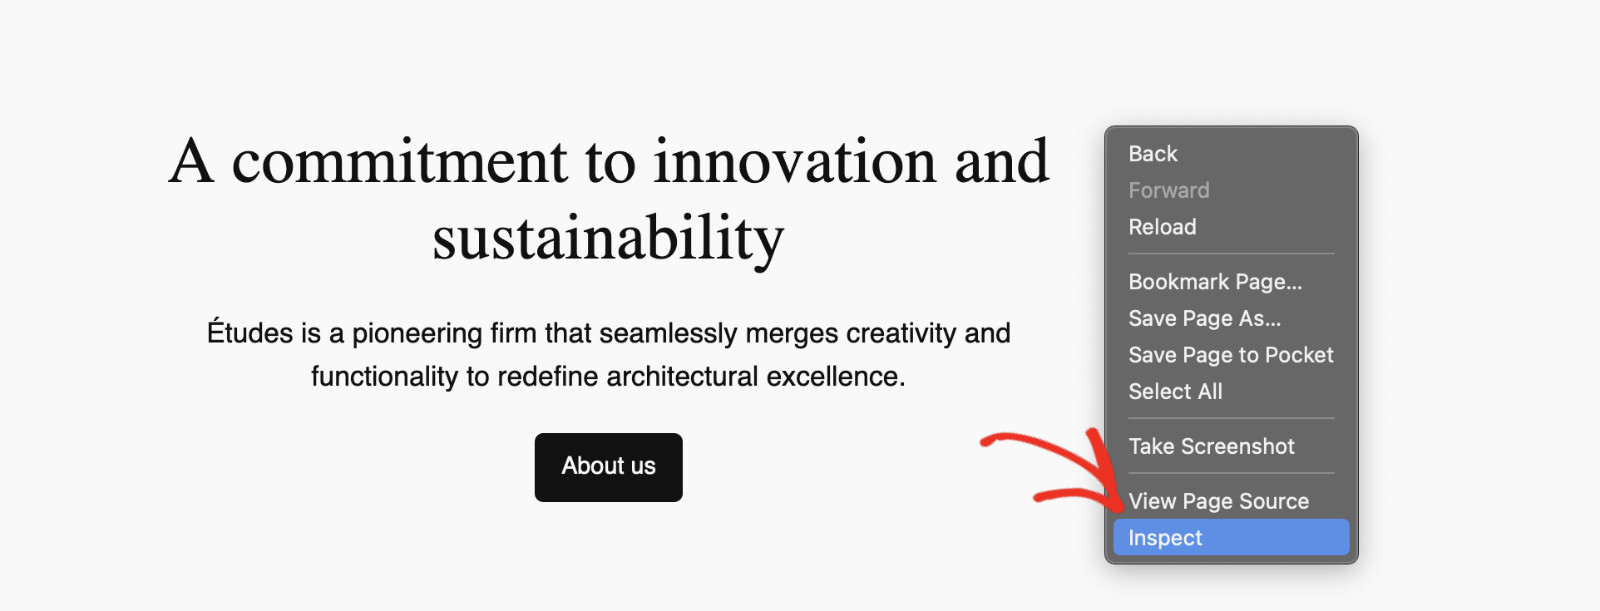
Alternatively, you can launch developer tools by right-clicking anywhere on a web page and selecting “Inspect,” regardless of your browser. Here’s an example of the Google Chrome browser.
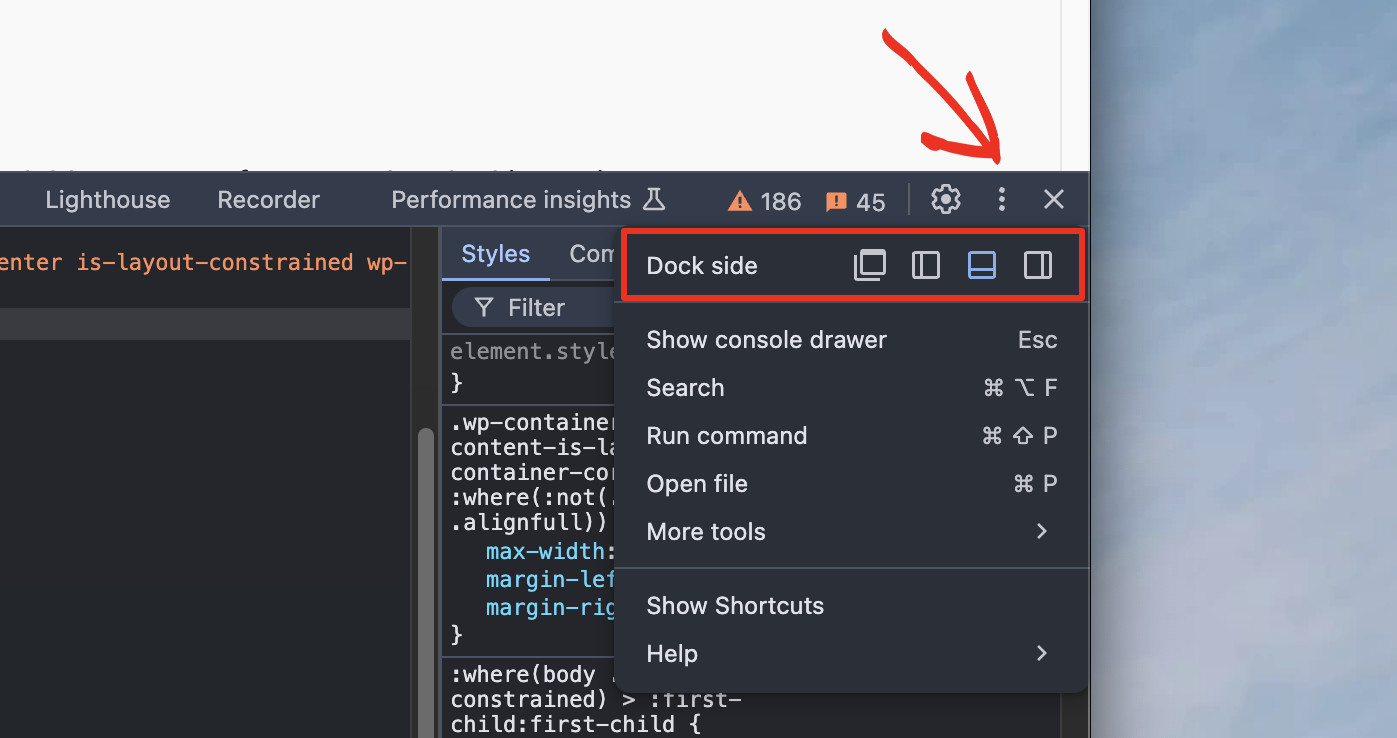
The position of the Inspect dock varies, but you can change it by clicking on the three-dot menu and selecting the ‘Dockside’ position. The icon to click is shown in the image below.
Practical Examples Of Developer Tools In Action
Developer tools are essential for designing and developing web pages. Let’s explore a few key features that are especially useful if you’re a WPCode user.
For the rest of this article, we’ll use the Google Chrome developer tools as a reference. Similar features are also available in all other major browsers.
Debug JavaScript Errors Using Developer Tools
JavaScript powers many interactive features on your website, but errors in the code can break functionality and disrupt the user experience. These errors are often hidden, making them difficult to spot.
The Console in Developer Tools is the best tool for finding these issues. It logs errors, warnings, and other messages from your site, helping you quickly identify and fix problems.
To open the Console, go to Developer Tools and click on the “Console” tab. For quick access, you can use the keyboard shortcut “Ctrl + Shift + J” (Windows/Linux) or “Cmd + Option + J” (MacOS).
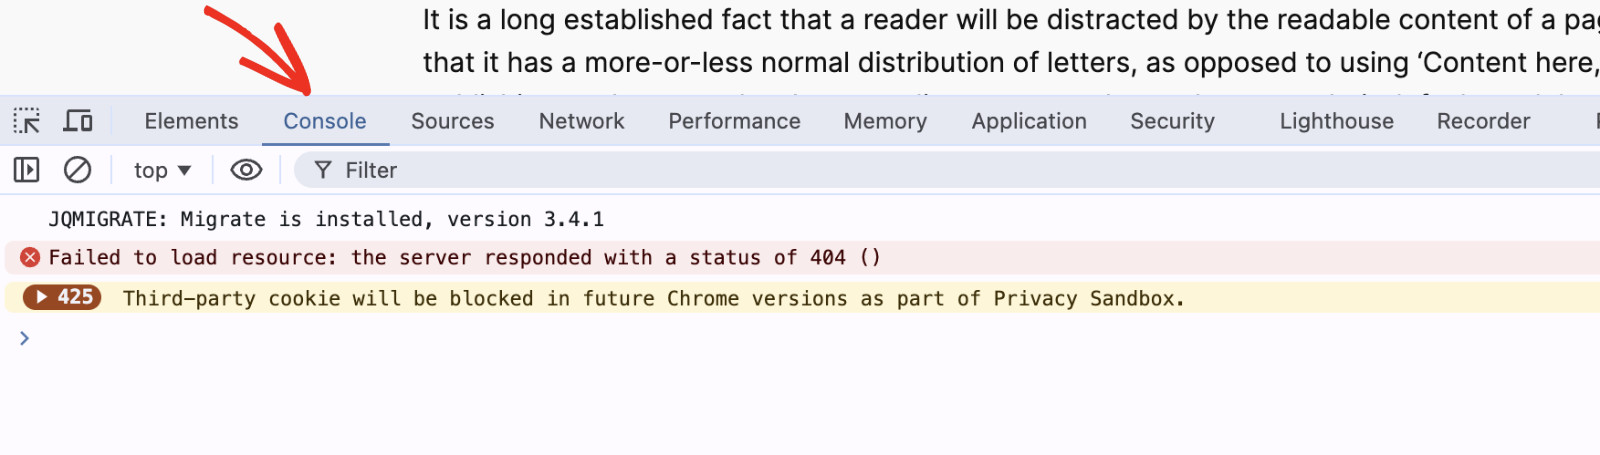
Look out for red error messages—they highlight where your code has a problem, explain what’s wrong, and point you to the exact spot in your code. You can go straight to the issue by clicking on these messages and start fixing it.
If you’ve added custom JavaScript using WPCode and it’s not working correctly, the Console will help you find out what went wrong and fix it quickly without affecting your live site.
Inspect and Modify HTML/CSS Using Developer Tools
One of the most powerful features of Developer Tools is the ability to inspect and modify your website’s HTML and CSS in real-time. This feature is particularly useful for making quick adjustments or trying out new designs without changing your main code.
To get started, open the “Elements” panel in Developer Tools. You can do this by right-clicking on any part of your webpage and choosing “Inspect” or by pressing “Ctrl + Shift + I” (Windows/Linux) or “Cmd + Opt + I” (Mac).
You’ll see the HTML for the selected part highlighted and the CSS rules on the right. Here, you can edit the HTML or CSS directly. For example, you can change the text in a “<div>” tag or adjust the color of an element.
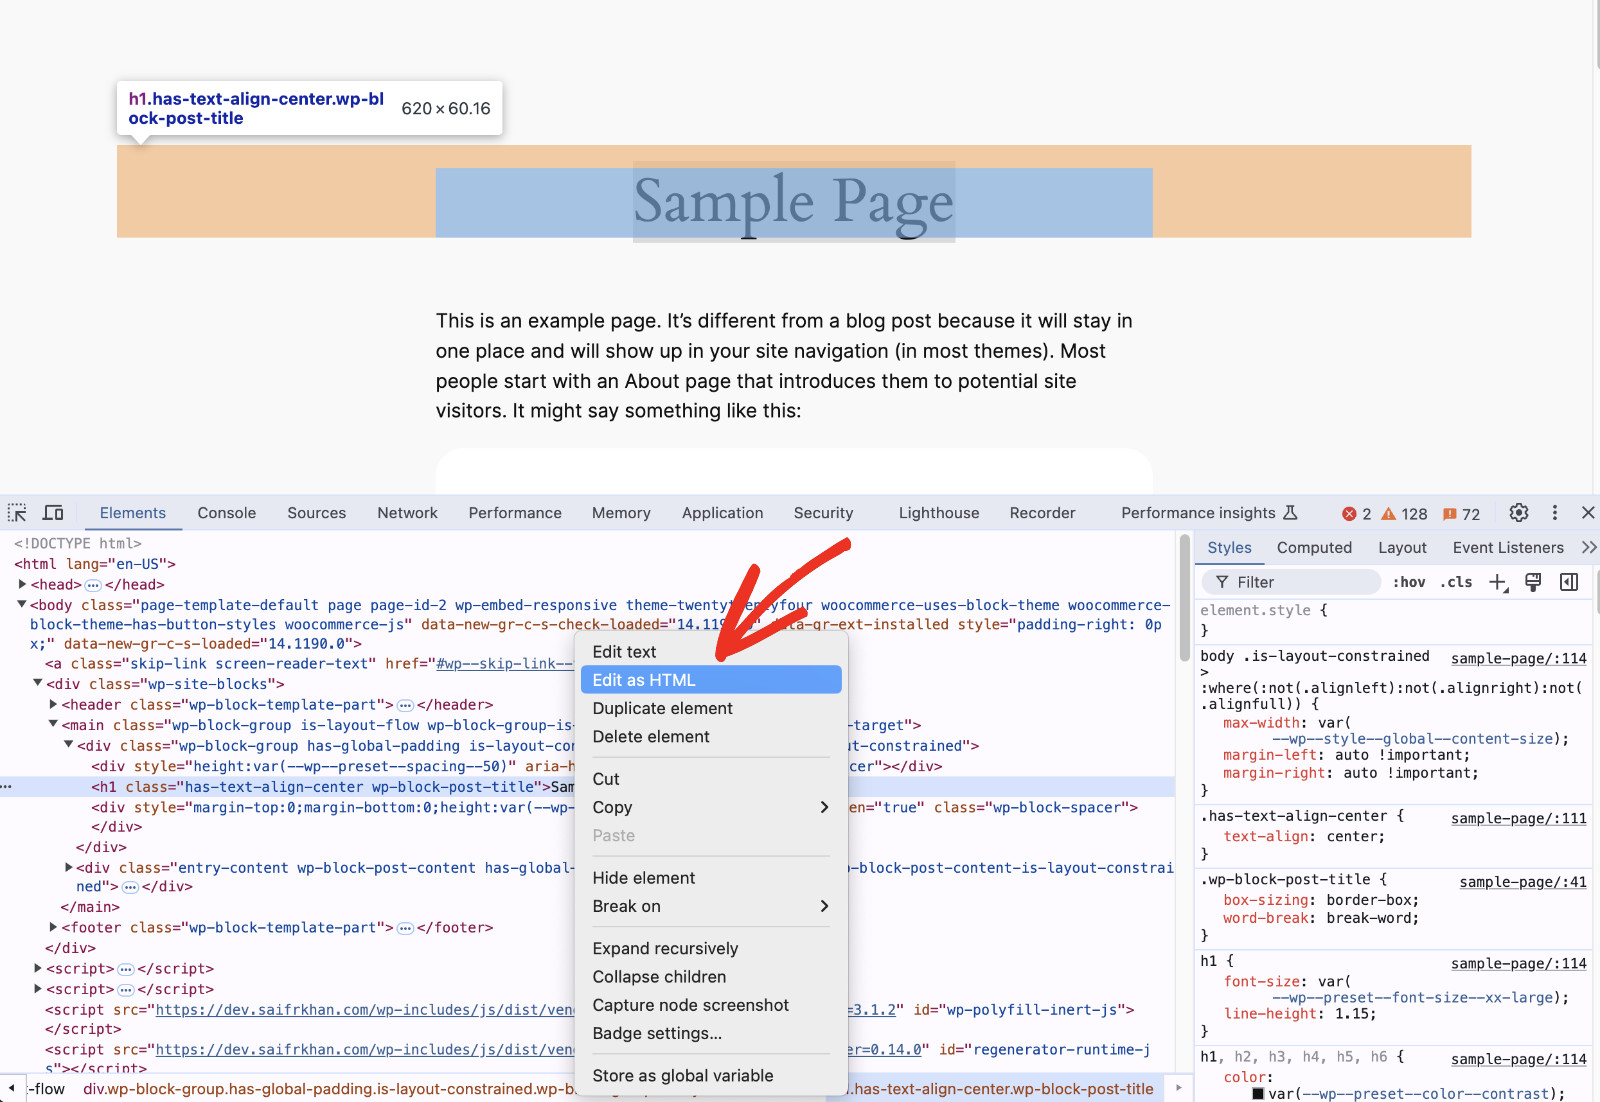
These changes are immediately reflected on your webpage, allowing you to see how your edits look immediately. This is useful for adjusting the layout or styling of your site.
For example, if you added a custom CSS rule with WPCode that is not rendered as expected, use the Inspect tool to find the problem. You might discover that another CSS rule is conflicting with your custom style. You can then test different fixes directly in the browser.
Test Responsive Design Using Developer Tools
As more people use mobile devices, it is important to ensure your website works well on all screen sizes. Developer Tools can help you test how your site looks and works on different devices and screen sizes.
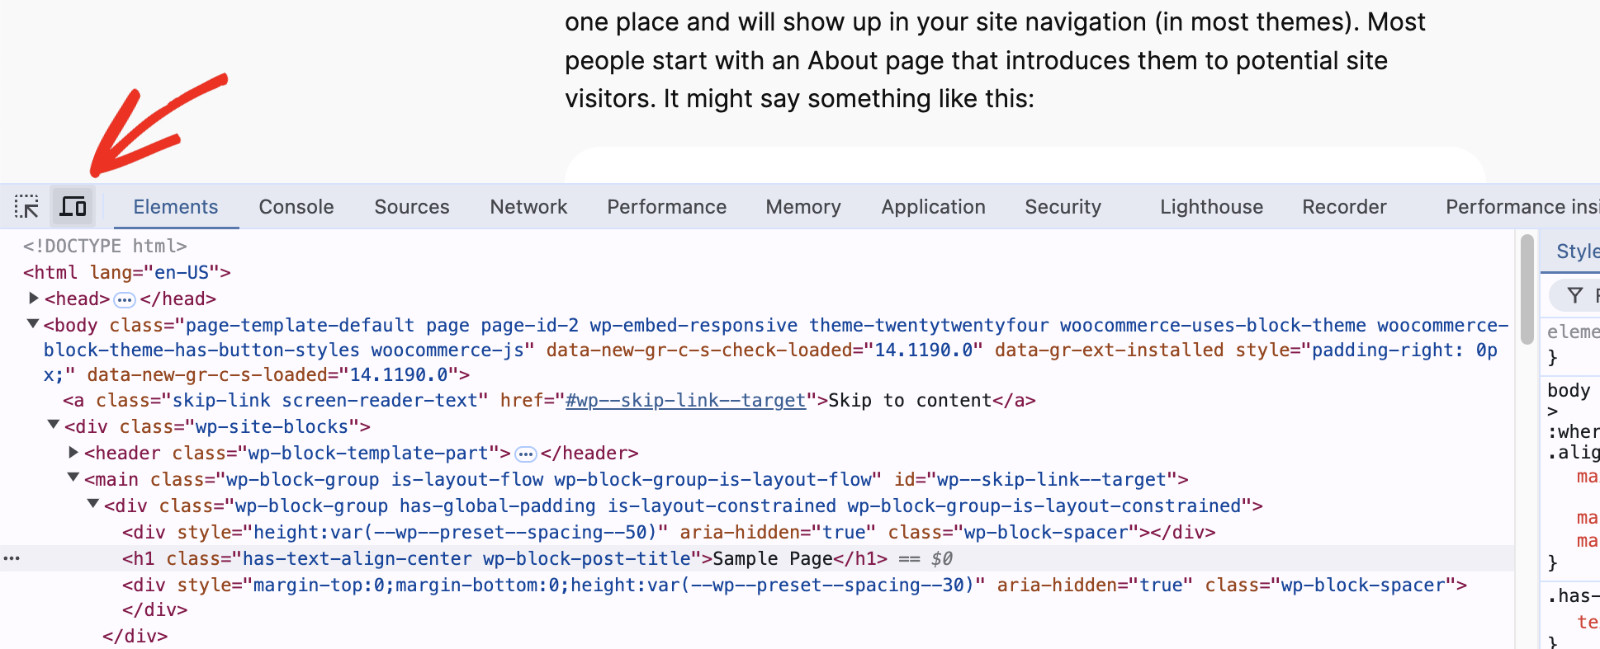
To start testing, open the Device Toolbar by clicking the device icon in the top-left corner of Developer Tools or by pressing “Ctrl + Shift + M” (Windows/Linux) or “Cmd + Shift + M” (Mac) when the panel is open.
The Device Toolbar lets you choose from different devices, like iPhones or Android tablets, and even set custom screen sizes. You can resize and rotate the screen to see how your site adjusts to different sizes and orientations. This helps you check if your CSS media queries are working correctly and your site looks good on all devices.
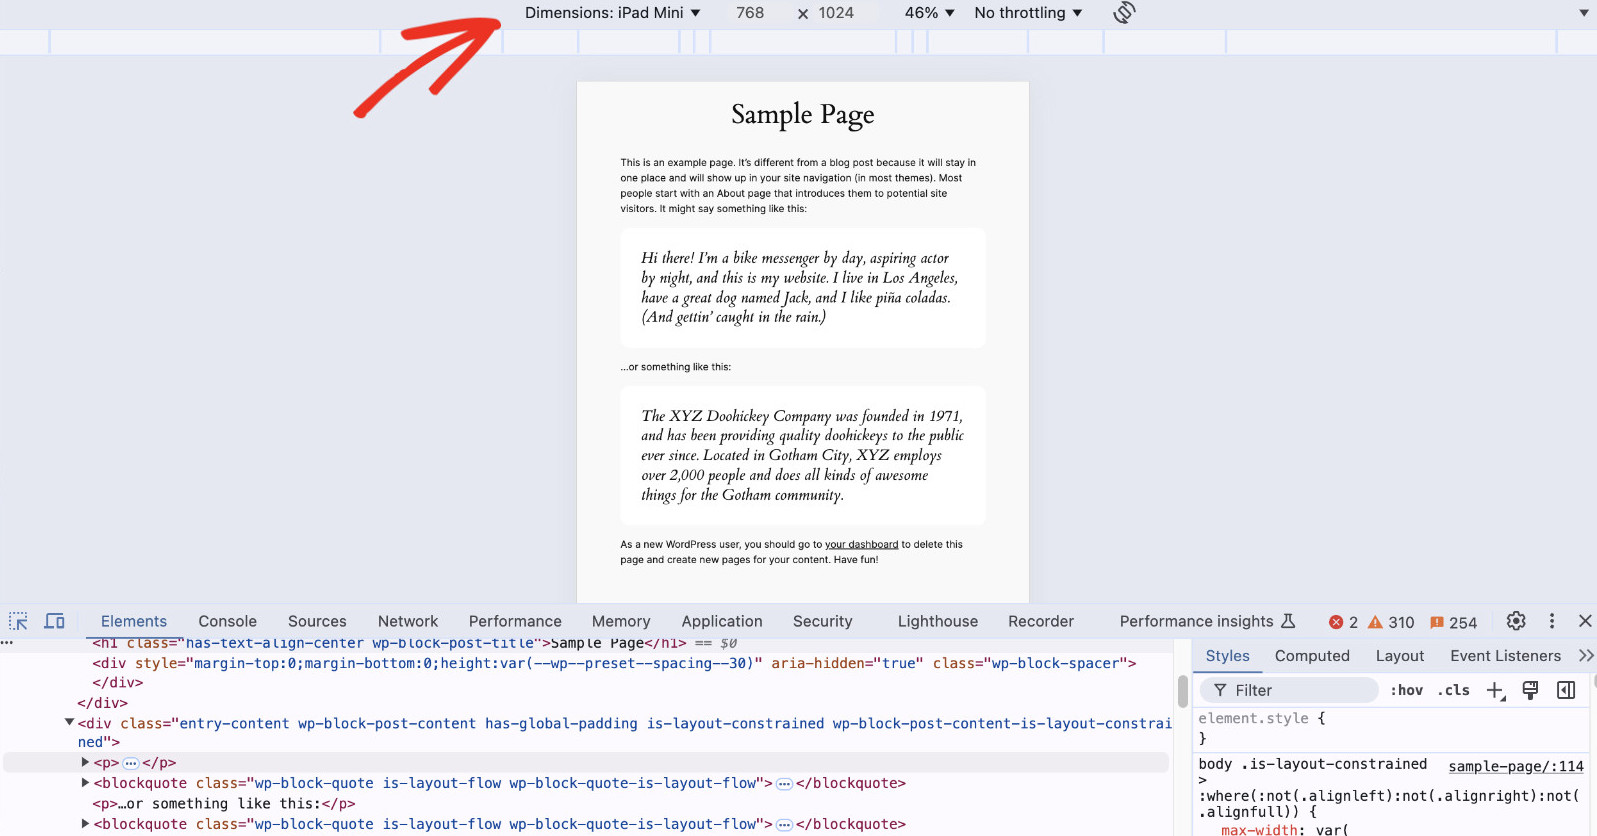
For WPCode users, this tool is great for testing custom code snippets (like banners or sliders) on different devices. If a snippet doesn’t work on mobile, you can find out why and fix it, like adjusting a CSS rule for smaller screens.
Using Inspect Element to Fix WordPress Issues
Knowing how to open Developer Tools is the easy part. The real value comes from using it to solve actual WordPress problems. Here are the five situations where I reach for Inspect Element on a WordPress site.
1. Find the CSS Class of Any Element You Want to Style
Want to change a button color or hide an element, but don’t know what to target? Right-click the element and choose Inspect. The Elements panel highlights its HTML, and you’ll see its class or ID right there, something like class="wp-block-button__link".
Copy that class name, then add your custom styles with a CSS snippet. Our guide on how to add custom CSS to your WordPress site walks through the whole process. Your changes survive theme updates because they live in WPCode, not your theme files.
2. Test CSS Changes Before You Commit Them
In the Styles pane, you can edit any CSS value and see the result instantly. Change a font size, adjust a margin, or try a new color. Nothing is saved, so you can experiment freely. Refresh the page, and everything resets.
Once you’ve found values you like, copy the finished CSS into a WPCode CSS snippet. This workflow means you never save broken styles to your live site.
3. Check Whether Your Code Snippets Are Actually Loading
Added a tracking script or custom code but not sure it’s running? Open Developer Tools, press Ctrl + F (Cmd + F on Mac) in the Elements panel, and search for a unique part of your snippet, like your Google Analytics measurement ID.
If it appears, the snippet is loading. If not, check that the snippet is active in WPCode and that its insertion location matches the page you’re testing. Caching plugins can also serve an old copy of the page, so clear your cache before testing.
💡 WPCode Tip: Snippet not showing up in your search? In WPCode, open the snippet and check its Insertion settings. A snippet set to “Site Wide Footer” won’t appear in the header, and a snippet with conditional logic only loads where its rules allow. See our guide on how to insert scripts in WordPress for choosing the right location.
4. Debug Plugin Conflicts With the Console
When a slider stops sliding or a form won’t submit, a JavaScript error is usually the cause. Switch to the Console tab and reload the page. Errors show in red, and each one names the file that caused it.
The file path tells you which plugin or theme is responsible. For example, an error in /wp-content/plugins/some-slider/js/main.js points straight at that slider plugin. Deactivate it to confirm, then update it, replace it, or contact its support with the exact error message.
5. Find What’s Slowing Your Pages Down
Open the Network tab and reload the page. You’ll see every file your site loads, with its size and load time. Sort by size to spot oversized images, or by time to find slow scripts.
Huge images are the most common finding. Compress them and the page speeds up immediately. WPCode’s conditional loading features also help here, since you can stop snippets from loading on pages that don’t need them.
FAQs About Inspect Element
What is the shortcut for Inspect Element?
Press F12, or Ctrl + Shift + I on Windows and Cmd + Option + I on Mac. This works in Chrome, Firefox, and Edge. You can also right-click any element on the page and choose Inspect, which opens Developer Tools focused on that exact element.
Does Inspect Element change the website permanently?
No. Any edits you make in Inspect Element only exist in your own browser. Refresh the page and everything returns to normal. The website’s actual files never change. That makes it a safe playground for testing CSS and content changes before applying them for real.
Is it safe to use Inspect Element?
Yes, completely. Inspect Element is a built-in browser feature made for exactly this purpose. You are only viewing code the website already sends to your browser. You cannot break a site, access its server, or see hidden data like passwords stored on the server.
How do I use Inspect Element on a phone?
Mobile browsers don’t include full Developer Tools. The easiest option is your desktop browser’s device mode: open Developer Tools and press Ctrl + Shift + M (Cmd + Shift + M on Mac) to preview the page at phone and tablet sizes. For real devices, Chrome supports USB debugging via chrome://inspect.
Why is Inspect Element not working?
First try the keyboard shortcut, since some sites disable the right-click menu with JavaScript. If F12 does nothing, check that Developer Tools isn’t restricted by a browser policy, which happens on some work or school computers. In Safari, you must first enable the Develop menu in Settings, under Advanced.
Conclusion
Developer Tools is like a Swiss Army knife for web developers. It has many features that help you build, test, and improve websites more easily. Whether you’re new to web development or an experienced developer making final tweaks, knowing how to use Developer Tools will make your work much easier!
We hope you were able to learn how to use Developer Tools efficiently. If you like this tutorial, we believe you’d love to know how to insert scripts in WordPress.